What is Price Action - Part 3
Updated: 2017-10-09 11:58:27In this third extension, we will go over the topic of refining our entries even further using a technique known as “blind touch trading”. This is an advanced lesson and if you found your way here without reading Part 1 and Part 2, make sure you go back and absorb that information.
Some Prerequisites First
Without the proper background knowledge, you’ll find this entire article to be confusing and unhelpful. Before going ahead, there’s a set of skills you should have.
1. You should be able to determine these areas of interest on your chart:
· Support and resistance levels
· Trend lines
· Fibonacci retracements
· Big round numbers
· Significant moving average
2. You should also be able to identify these key price action patterns when viewing candlesticks:
· Outside bars
· Pin bars / Dojis
· Inside bars
All of the above should be old news to you. You’ve recognized, analyzed, and acted upon these things numerous times in the past. Again, if you need review, look back at the articles linked above. If not, let’s get going.
Take a Moment to Think About Your Usual Entry Approach
How would you usually enter using price action setups? More likely than not, you’d end up waiting for price to reach a significant level on a higher time frame, then look for candlestick price action patterns to confirm your entry. Take a quick look at the following example.

NZDJPY chart with daily candles

NZDJPY chart with hourly candles
Looking at a daily chart we can conclude that NZDJPY’s price has been ranging between 84 and 86. From there, we hop down to an hourly chart where we can clearly see the support at 84 and 84.5 with resistance below 86.
Typically, each entry would be taken after one of our major price action patterns (like a pin bar or outside bar) confirms support and resistance levels.
Since this market is in a very tight range, it’s reasonable to assume price will stay within its recent range until a major event causes this to change. As such, waiting for confirmation on a daily candle would be counterproductive, so we would look to enter after a 4H or 1H candlestick confirmation.
But this begs a very important question:
Can My Entry Be Better?
Could we increase our edge even more by entering a trade before price has already started to move 20-40 pips away while we wait for it to form our entry signal? The fact is that the source of a move you’re trying to profit from is the level itself at which price turns. The move doesn’t start after a pin bar was formed on a 4hour chart, yet that’s where you choose to enter.
Instead, would you not consider it more effective to enter at the source of the move? That pin bar you’re seeing now only shows you that the order flow from a significant level reversed the direction of price. It doesn’t mean mean that upcoming orders (after a pin bar was formed) will continue pushing the price in that direction.
Our goal should be to enter at a level that causes other traders to follow the direction of our trade and create a favorable flow of orders. If that order flow stops, we want our exit options to be better than those of the traders that foolishly entered 20+ pips late.
The Concept of Blind Touch Trades
Don’t let the name fool you into thinking this technique isn’t effective; these price action trades are high reward: risk ratio and are only called ‘blind’ because you don’t wait for a candlestick confirmation to take your trade. They’re also known as ‘touch’ trades because you’re entering at a significant level that price only touches. This will make more sense as we analyze some real-world examples below.

“Whoa, where are the candlesticks,” you ask? Exactly. Our aim is to front run expected order flow at major levels by not wasting our time waiting for candlestick confirmations. With this mentality, the scenario would play out something like this:
We would go short at 1.55 on March 3rd as that level was first resistance and then acted as support on January 27th. After that it was retested from below and then turned to resistance on February 4th. Also note how price accelerated into 1.55 and exceeded its 24hour ATR. Our stop loss would be around 35 pips. We would exit half of our position at 1.5350 and at that level we would move our stop to breakeven and look to exit other half at 1.52.

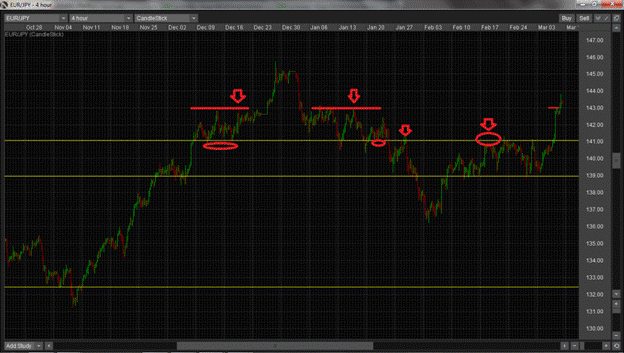
In this case, our main trade would be a short from 141 on February 17th because that price level acted as strong support and was then retested from below on January 28th when it turned to resistance.
You may also notice a good trade at the 143 level on March 6th but it would not be taken because on that day NFP came out and this type of trading style avoids taking positions ahead of event risk.

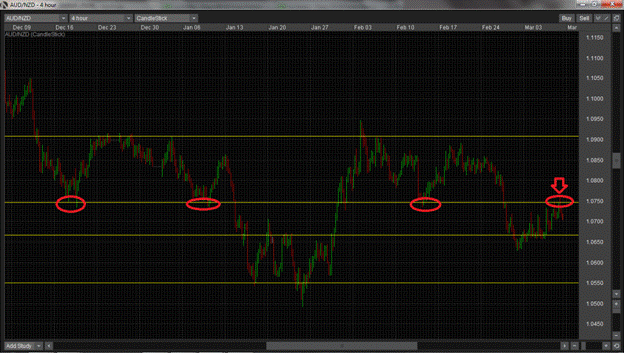
In the last example here, there was a good setup at 1.0750 level which price respected as support and now (as expected) it turned to resistance. Stop loss would be 20 pips. We would look to exit at 1.0650.
What exactly should I be looking for to take a blind touch trade?
You are looking for well respected and clearly defined areas that every trader sees. As mentioned in the previous installments, ideally we want to enter a trade when many of these areas overlap and create confluence:
· Support and resistance levels
· Previous swing highs/lows
· Trend line touches
· Fibonacci retracements
The expected strength of these levels depends on how many times before that these levels been tested and how price reacted to them. Take note that a level has been tested many times usually starts to lose its strength.

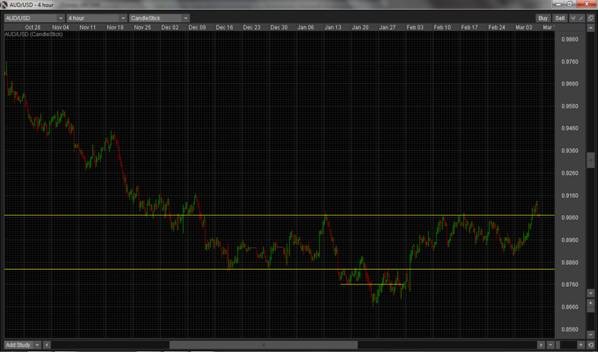
We can see AUDUSD resistance at 0.9070 being tested three times. After that many retests we wouldn’t trade that level as resistance but as possible support after price breaks higher.
In addition to eyeing the aforementioned major levels, keep the following in mind as well.
· Stay on lookout for how far price has moved on the day in comparison to its average daily range. If the ADR is 60 pips but price moved 95 pips in one direction that day, it won’t likely have enough strength to break through a significant technical level (unless there was a very important event, which is to be avoided with this kind of trading anyway)
· Don’t forget about the clock. The time of day when price approaches areas of value is also really important.During illiquid US or Asia times, price is more likely to stay within its range and be rather boring. The more powerful moves tend to happen during the earlier parts of the US and EU sessions.
Some basic guidelines for your entry, exit, and stop loss
Trades using this technique are managed on charts with hourly candles. Higher time frames are only used to see the bigger picture.
· Entry is at a significant level (minus 3 to 8 pips for spread and slippage) which we’ve defined earlier.
· Exit points are where you take notice of the order flow no longer favoring your side or at an opposing major level.
· Stop loss is set around 1/3 the ADR above the level we are trading (e.g., if the ADR is 60 pips for the pair you’re trading, your stop would be placed about 20 pips away). Unless you’re trading when there is event risk (which is highly advised against), price usually won’t be moving too far past your entry.
Exits and stop losses are very discretionary and understand that tightening your stop will increase your reward: risk ratio but it will also reduce your win rate.
Pros and Cons to Blind Touch Trading
Pros
· This style is very good at trading ranging markets when there is no large event risk around (and markets are in this state rather often).
· If the trade gives you signs that it’s going to go sour, you usually get a chance to exit at breakeven, which really helps limit overall account drawdown.
· You’re usually entering ahead of the crowd, helping keep order flow on your side and trade-by-trade drawdown low.
Cons
· The highly discretionary nature of this requires you to be really develop the execution skill involved
· Your trade needs to be actively managed after you enter
· Event risk must be constantly monitored
Final Thoughts
While this style of trading provides an edge to the active, disciplined trader, losing control of yourself can very quickly lead to a large volumes of stupid losing trades. It’s absolutely critical to manage your psychology as a trader and be able to patiently wait for the optimal opportunities. Tracking, logging, and reviewing your trades will be an important part of this self-control development.
With that said, the payoffs using this approach have very high potential with very little drawdown as you stay ahead of the crowd, which is the exactly type of trading that most aspire to achieve. If you’re serious about optimizing your execution, take full advantage of this technique and let the profits keep on coming.
