Long Term Sentiment Analysis Example: #GBPUSD
Updated: 2017-10-09 09:07:18Sentiment analysis can be done using price action and how it reacts to certain price levels and certain news events. This is a very important part of sentiment analysis … but it can be analyzed more accurately by looking at different sources of information. This article will show how to analyze a change in longer term (days/weeks) sentiment using various tools, such as:
- Commitment of Traders (COT) Report analysis
- Daily Open Interest (OI) analysis from the futures market
- Fundamental data
- Option barriers
- And most importantly … Price action
I will step through the analysis over a several week timeframe, looking at snapshots in time and analyze what is going on for the sentiment.
May 21, 2013
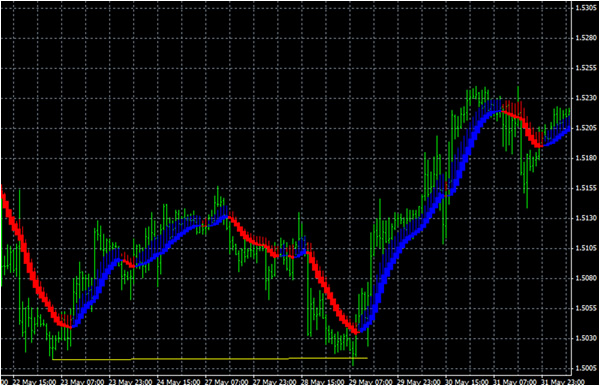
GBPUSD is in a downtrend since 1.56, as seen by the daily chart below:
Sentiment has clearly been down.
The Commitment of Traders report comes out each Friday, based off of data from the previous Tuesday’s close (if there is a holiday Monday its delayed 1 more day). The COT is based off of futures contracts (not Forex), but analysis of the futures market can provide insight into Forex.
The COT report can be broken into commercial traders (who hedge), non-commercials (typically funds who are trend traders), and small players (retail). The largest reported holders are commercials and non-commercials. Commercials are increasing positions against the trend (hedging), while non-commercials are increasing positions with the trend (trend following funds). We will focus on the non-commercial traders … hereby referred to as ‘funds.’
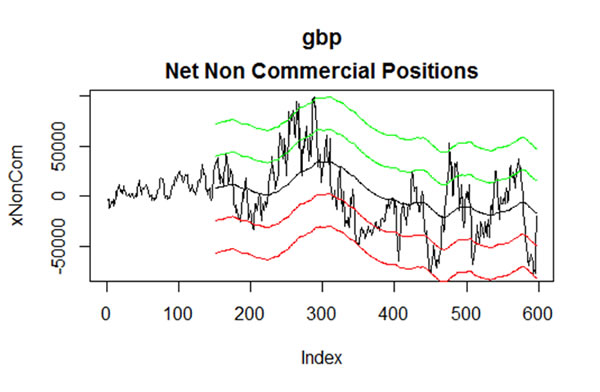
Now looking at the COT report from 5/21, we look at the funds positioning:
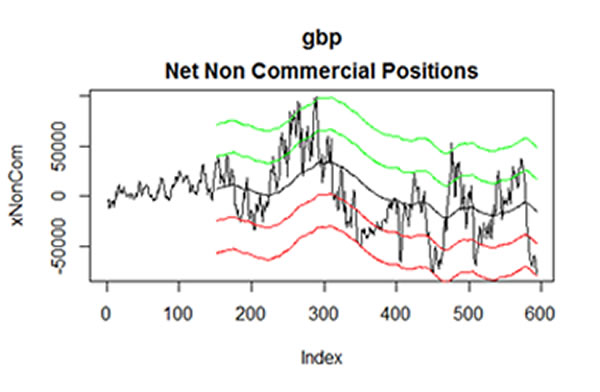
The black up and down line is the net fund position (longs minus shorts), the black smoothed line in the middle is the 3 year mean, the green/red lines are +/- 1 and +/- 2 standard deviations from the mean. We can see that funds are at -2 stdev from the 3 year mean. When funds are highly short at record levels, everyone is on one side of the trade. When this happens, we look for indications that a trend reversal may be coming soon.
May 28, 2013
A week later we see a bounce from the 1.50 level (a major options barrier), and then a retest of the barrier. At this point if the 1.50 level holds, a double bottom is formed, so we look for indications that sentiment has changed.
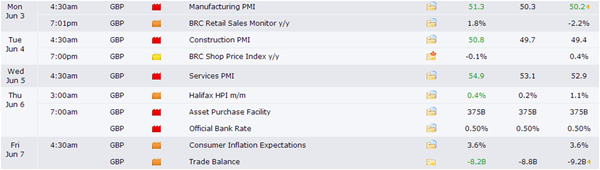
First we look at the GBP fundamental data in the past week:
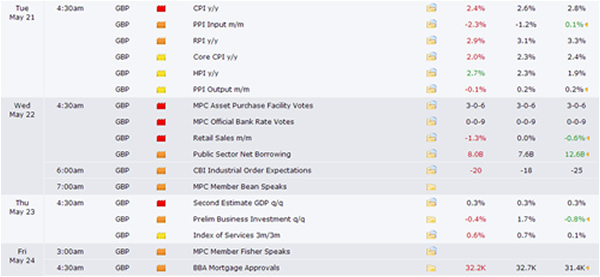
GBP has mostly missed nearly all of the fundamental news release expectations, but GBPUSD has not made new lows. This is a good sign that sentiment has changed.
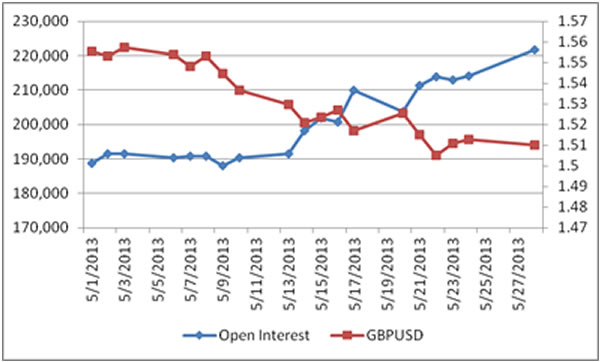
Looking at daily OI and price, we see that OI is increasing as price is decreasing, which is bearish. We will look later at OI for clues/confirmation that sentiment has changed.
May 29, 2013
With the fundamental news not good for GBP but no new lows in GBPUSD, we look to get long after a possible double bottom at 1.50 (a major option barrier). Looking at the1 hour GBPUSD chart, a yellow line is drawn from the previous low and extended horizontally. We see that on 5/29 this low was breached as some stops hit, but quickly large buying came in and price reversed up to 1.5040. The next bar the smoothed Heiken Ashi bar turns blue, which indicates an uptrend:
At this point we think sentiment may possibly be changing to bullish, so we long with stops below recent lows, and look for further confirmation that sentiment has changed to add to positions.
May 31, 2013
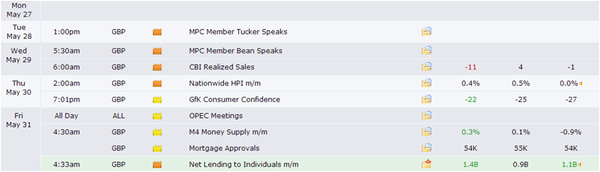
Recent fundamental data has been good for GBP:
The 1 hour chart shows an uptrend starting on GBPUSD. Spikes down in price are quickly met with buyers and price quickly returns to rise again:
This is a good confirmation of the bullish sentiment.
June 7, 2013
Over the next week there were numerous confirmations of positive sentiment for GBPUSD. There were many places for additional optimized entries with little risk (possibly to be covered in a later article).
First, fundamental data was consistently good:
Secondly, open interest decreased while price increased. In this case (remember before from the weekly COT analysis that funds were heavily net short), the funds are exiting their short positions so OI is falling. As they exit price rises.
Price action on the 1 hour chart shows a solid uptrend:
The price spiked above 1.56 (recent highs), which was an excellent place to take profits:
GBPUSD ran over 600 pips in just 1.5 weeks. Sentiment was negative before the run … with so many funds short, they got squeezed when sentiment changed. With our analysis of fundamental data, price action, the major options barrier at 1.500, COT, and daily open interest, we were able to see how sentiment changed.
June 21, 2013
A couple of weeks later looking at the COT data, we see that the funds that were at extremely short levels have covered, and now positions are just below the 3 year mean (black line). The GBPUSD price ran up to 1.57 in the past two weeks.
Please provide feedback (good or bad) on this article. I would like to improve the analysis if I can and am always open to new ideas!
Regards,
EZcurrency