How to Harness Volatility
Updated: 2017-10-05 13:37:58Events have recently attracted more attention to the Foreign Exchange market than ever before. Once again, at the Order Flow Trading Academy we wish to keep aspiring traders on the right path and away from trends like this. Many traders are attracted to FX because they are told that it's the “most liquid instrument to trade”. In a previous article we touched on the actual issue of liquidity in the FX market – which is being reduced, not augmented. In this article we are going to explore the actual value – if any – of liquidity and what is instead important for trader profitability (big hint: volatility!).

1. Is there a link between Liquidity and Profitability
Let's go straight to the point: when I was learning how to trade, liquidity was the last of my problems. As an individual trader, I am so small compared to the whole market that everything actually felt overwhelming.
While liquidity IS an issue for large traders and funds, liquidity is not the key to individual trader profitability. There are many other more important considerations for the individual trader. Volatility is one of the more important considerations for the individual trader.

Do traders really need to stay away from volatility?
Or is there a link between trading and volatility?
But first let's explore the real liquidity of the FX market. The Foreign Exchange Joint Standing Committee recently released the results of it's 21st semi-annual turnover survey. The main findings are:

Source: FX Joint Standing Committee
Of course this report makes it sound like there has been an enormous increase in liquidity in the FX market and that traders of all kinds should line up and take their shot. But here's the catch: turnover is NOT liquidity.
According to the New York Fed (newyorkfed.org), turnover is defined as:
“... the gross value in U.S. dollar equivalents of purchases and sales entered into during the reporting period. “
and also,
“No distinction is made between sales and purchases (for example, a purchase of $3 million against the U.S. dollar and a sale of $2 million against the U.S. dollar would amount to a gross turnover of $5 million).”
“Transactions passing through a vehicle currency are counted as two separate transactions against the vehicle currency (for example, if a bank sells $1 million against the euro and then uses the euro to purchase Japanese yen, the reported turnover would be $2 million).”
whereas liquidity is a difficult concept to define and therefore measure. In general terms a liquid market is one where transactions can take place rapidly, with low transaction costs and little impact on price. So liquidity can be assessed in terms of:
- transaction costs (bid/ask spread);
- the ability for large transactions to be absorbed without affecting prices (depth);
- the time taken for prices to return to normal after temporary order imbalances (resilience);
- the speed at which trades are executed (immediacy).
But the common individual trader does not really have access to this kind of information, so how can the common investor understand how much “depth” and liquidity there is in the market he's trading? There is an easier rule of thumb to follow, which is used by some “veteran” dealers:
Liquidity = % change in turnover – % change in volatility
The idea behind this rule of thumb is that you can read the industry reports issued by the Bank of England, the New York Fed, etc. and read the turnover change over a determined period of time. Then, you can simply subtract the change in volatility over the same period of time, to see what kind of moves (volatility) are necessary to process that amount of turnover.
In the example above, the FX Joint Standing Committee reported that there was an 18% increase in turnover in the EurUsd from April 2014 to October 2014. So we need to ask ourselves what the volatility conditions were like!
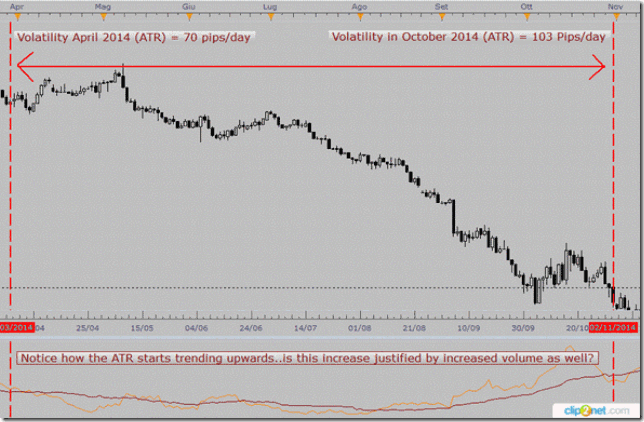
There was almost a 50% increase in volatility from April to October 2014! This means that liquidity actually decreased over the period: 18% - 50% = -32% adjustment. And yet, I am sure that many people have seen improving results in their trading since April 2014. Is there another reason for this?
2. Volatility, the key to profitability
Take a look at your equity curve from April 2014 to October 2014. Now compare it to this chart:
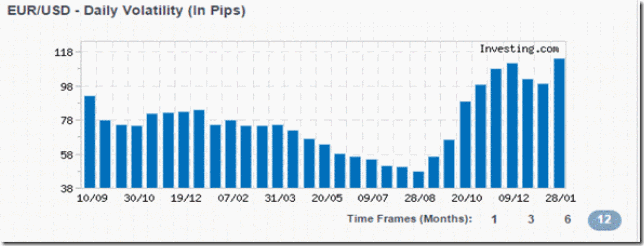
The main contention of this article is that investor profitability is positively linked to volatility.
Not liquidity. And now we will explore this link more in depth...
There have been a number of academic studies that have tried to measure the profitability of day traders across volatility states. The problem of academic papers is that they have difficulty simulating real trader's behaviors because they do not usually know how traders act and/or make decisions. However, a series of papers (please see the references at the end of the article) decided to use the Opening Range Breakout strategy in their studies, as it has become more of a mainstream strategy in futures markets.
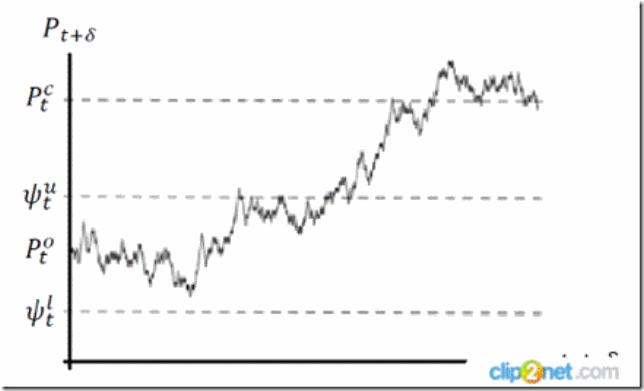
The rationale of the ORB strategy: from the open (Pt) if the market breaks above/below a threshold, the trader will buy/sell the security. In FX, this strategy was translated into the Asian Range Break.
The ORB strategy is based on the premise that if the price moves a certain percentage from the opening price level the odds favor a continuation of that move until the closing price of that day. The trader should therefore establish long (short) position at some predetermined threshold a certain percentage above (below) the opening price, respectively, and exit the position at market close.
By applying the Opening Range Breakout strategy (ORB) on long time series of crude oil and S&P 500 futures contracts, and calculating average returns for each volatility state, significant changes in ORB profitability levels across volatility states have been confirmed. This finding suggests that day trading profitability and, in turn, market inefficiency may be highly correlated with volatility.
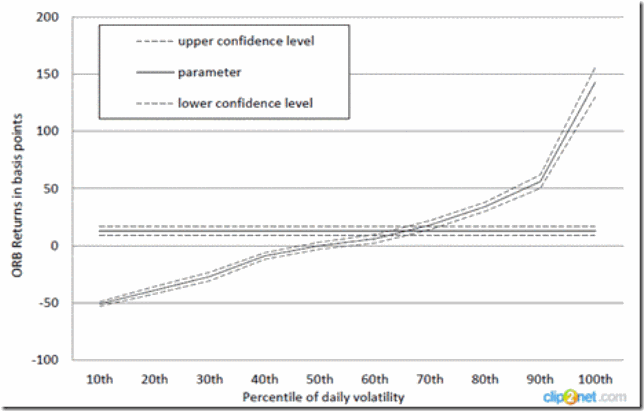
YES: Volatility and profitability are linked
Source: Day Trading Profitability across Volatility States - Christian Lundström – 2013
The implication is that a day trader, profitable in the long-run, may experience long time periods of zero, or even negative return during periods of normal, or low volatility. Thus, even if long-run profitability is possible to obtain, it is achieved only by the trader committed to trade every day, for a very long period of time, or by the opportunistic day trader restricting his trading only to periods of high volatility.
3. In search of Volatility
So now we have found out that volatility definitely affect our profitability as traders. In this light, it might be useful to actually search for markets that are more volatile, so that we automatically raise our odds of succeeding, when attempting to day trade them.
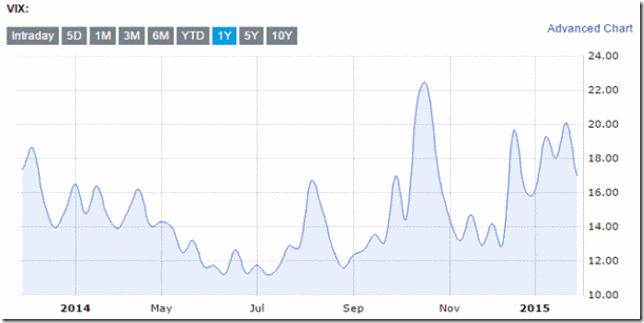
Vix Index – the volatility level of the S&P 500
Source: cboe.com
Above is a chart of the VIX Index, the volatility index for the S&P 500 – possibly THE most followed benchmark index in the world. Notice the level of volatility: it hits 12% (annualized) at the lows and is now sitting around 18% after being in the 20s. Now let's compare that level of volatility with the Euro FX volatility (EVZ):
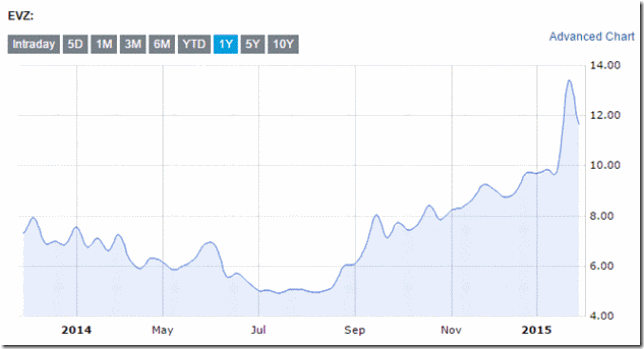
EuroCurrency Volatility Index (EVZ)
Source: Cboe.com
As you can see, even if the Euro has been attracting more volatility, the levels that seem so high nowadays in FX are basically the lows (12%) for the S&P 500! Since academics and practitioners have realized that profitability of day trading strategies are highly correlated to the volatility of the security traded, does it make that much sense to get so caught up in the FX markets?
One of the main reasons why FX is more difficult to trade is that it does have a lower volatility than other markets, and this means that day trading strategies will suffer to a certain extent.
The Next Step: this article has attempted to shine some light on the “folklore” surrounding the overwhelming “liquidity” of the FX market. You do not need to trade FX for it's liquidity. Liquidity does very little for your profitability as a trader. Instead, you should search for Volatility. I know what you're thinking: volatility goes both ways, and is usually higher when the markets fall. That's very true: you will need to not only to filter market conditions, but also know how to stay on the right side of volatility more often than not. Knowing how to identify market sentiment can help you stay on the right side of the market, but that's a topic for another article.
References:
1. Can Individual Investors Beat the Market? Coval, Hirshleifer ,Shumway - 2005
2. The Behaviour of Individual Investors – Barber, Odean - 2011
3. Assessing the profitability of intraday opening range breakout strategies - Holmberg, Lonnbark, Lundstrom - 2013
4. Day Trading Profitability across Volatility States - Christian Lundström – 2013
5. http://www.bankofengland.co.uk/markets/Documents/forex/fxjsc/fxturnresults150127.pdf
6. http://www.newyorkfed.org/fxc/volumesurvey/explanatory_notes.html
7. http://www.rba.gov.au/publications/bulletin/2008/dec/pdf/bu-1208-1.pdf
