Price Action Patterns
Updated: 2017-10-05 12:15:10Price action patterns are visual representations of human behavior and occur often and in similar form because human psychology doesn’t change. Every price print, bar, or candlestick is formed because of decisions that have been made by active participants in the market. As traders studied charts over time, they noticed certain price action patterns repeating and have developed strategies to make their own trades based on these patterns.
Many traders use price action patterns as entry signals and thus create strong order flow that we, as order flow traders, can use to our advantage. Because our goal is to metagame the participants that use this style of trading, it’s important that we stick to the most popular and widely used patterns. We’ll be looking at the 5 major price action patterns that have found their way into current market lore.

1. Rectangle
A rectangle formation is about as simple as its name implies: it’s defined by an upper horizontal line (resistance) and lower horizontal line (support). How do traders use this? They’re looked at as a “consolidation pattern”, which implies that price isn’t finding much direction at the moment, but is typically observed within a trending market and precedes further moves in that trend’s direction.

When the asset’s price spends a long time in this consolidation rectangle and traders become used to buying at one and selling at another level, a move beyond either level represents a major psychological change. This can be profitably traded when the broken level retested (when we often see a support flip into a resistance or vice-versa) because many traders who expected the level to hold are now trying to exit with a break even trade.
The order flow dynamic of retests makes trading them a profitable strategy especially since breakout trades of rectangles (price ranges) are usually unreliable because of stop hunts that produce many false breakouts. Apart from this breakout retest strategy, you can make plenty of smaller successful trades from buying when price reaches the support level or selling when price goes to resistance, but only if sentiment suggests the lower volatility and lack of direction will continue.

2. Flag
Flags are defined as trading ranges between two parallel trendlines and are mostly formed after a trending period, representing an equilibrium state at which profits are taken. In order for a line to represent a boundary it must be touched at least twice. When the range gets broken, it is usually done by a sharp price movement caused by new information that supports the underlying sentiment and fundamentals.
A downward flag represents a trading range with upward bias (although price is falling in that moment) and an upward flag represents downward bias, so the price movement that breaks the flag is usually in the direction of the larger trend that came before it.
The break of a flag usually represents a good opportunity to enter a trade if there is confluence with market sentiment (which order flow traders always need to keep in check). The problem is that sometimes it's hard to know exactly when price is breaking through the range so ideal entries are rare.
Retests of flags rarely occur and aren't reliable as retest of rectangles unless there is a major structural level (support or resistance) at the retest level.
3. Triangle and Wedge

While there are some slight differences between a wedge and a triangle, both are described as an ever-narrowing trading range bounded by two converging trend lines. Like noted for flags, a boundary must be touched at least twice to be seen as valid.
Wedge
A wedge pattern still holds the pressing market direction which makes trading the boundaries of a proven long-term wedge quite profitable, especially if sentimental bias and broad positioning supports the idea of continued moves in that direction. For the more reliable approach, conservative traders will trade the retest of wedge, but these retests don't happen too often.

Triangle
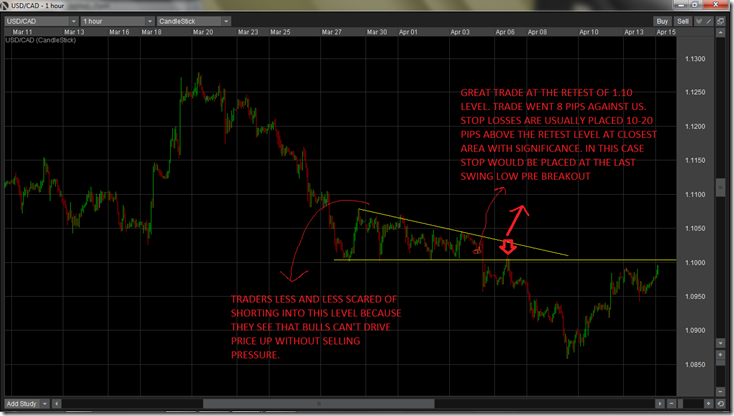
In a triangle, the horizontal line represents a very important level at which strong order flow shows up every time price visits it (usually horizontal line is a major level for its own reasons). Because of it's importance, the horizontal line rarely gets broken, but price keeps pressuring it and price reacts to that level less and less with upcoming tests. After 3 or more tests, price often breaks through in the desired direction. This makes the triangle be viewed as a directional pattern.
Trading a breakout of triangle is very unreliable, but trading the retest is an excellent opportunity with a great risk-to-reward ratio because of the psychological and order flow factors like the mass buildup of stops just past that horizontal line.

4. Head and Shoulders

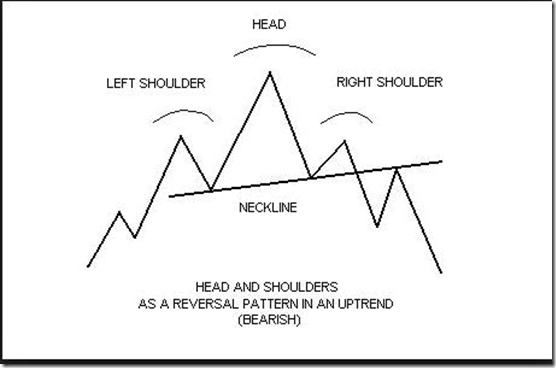
This pattern is considered to be a representation of distribution from strong hands to weak hands, making it a “reversal pattern”. It needs to be preceded by a strong uptrend and consists of two smaller rallies (shoulders) and a large rally (head). The neckline is drawn across the lows of the left and right shoulders
So first let's consider how it's formed: a strong rally forms the left shoulder, price pulls back but the buyers come again since they see this price as bargain compared to the last rally. They drive the price above the left shoulder into new highs (often times clearing out stops on the way up). Price now pulls back again, since there wasn't much support for price at those elevated levels. Price finds support near the lows formed after the left shoulder pullback. But traders that missed first two rallies and who are still bullish get back in and price rallies to form the second shoulder.
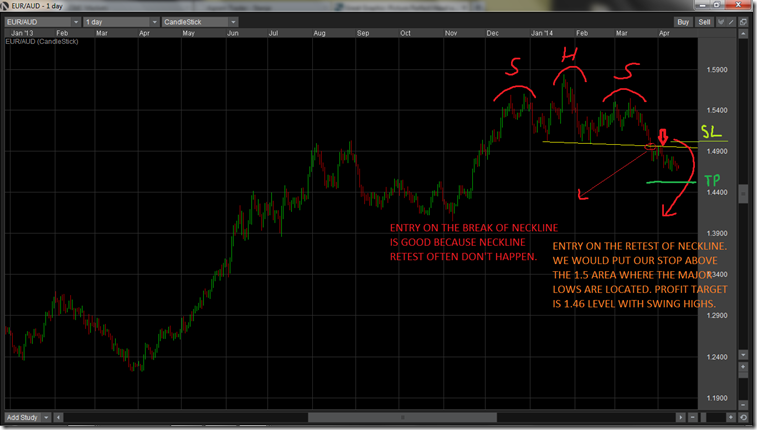
After the strong hands distributed all their holdings and are now net short or at least unwilling to buy again, the price is ready to plunge. Many longs still find themselves trapped in this scenario and are forced out, causing a strong round of selling. If the move below neckline was overdone, price rallies again and retest the neckline. Many traders who didn't participate in the neckline break gladly enter on the retest.
Entries can be taken after the initial break of the neckline or on a retest of neckline. Both methods are great. But keep in mind that retests don't always happen.

Inverse Head and Shoulders
The upside-down head and shoulders price action patterns also occurs on market bottoms, in which case it would be called inverse head and shoulders. but the principles are the same. In head and shoulders we had the final rally separated by two smaller rallies but with the inverse head and shoulders we have the final low separated by two higher lows. We also apply the same principle as with head and shoulders, so we enter at the break or retest of the neckline.
5. Double Bottom / Double Top

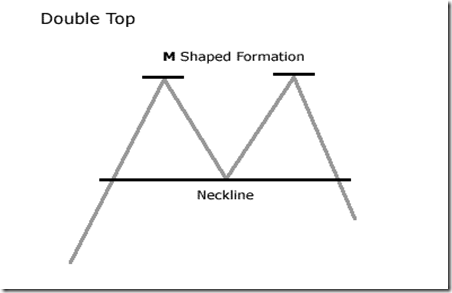
This pattern is formed after a strong uptrend made the first top, which is followed by a shallow decline caused by a general lack of interest at elevated prices. After the price drops, buyers see the current price as a bargain and the price rallies on same arguments as the first rally. The second rally is usually caused by lack of sellers and when the price reaches again the supply area that stopped the previous rally, sellers momentarily come back into control and are push the price in their favor.
A setup like this is a very wide sign for a notable support or resistance level. It’s the very type of level that many traders find themselves tucking their stop losses behind because they assume that whatever selling/buying that protected that level in the past will continue to be there. If these people are trading against broad sentiment, an opportunity arises here that allows us to target the cluster of stops beyond the double top or bottom.
If a double top or bottom forms that would allow you to enter in line with sentiment, they can instead be used as they’re intended to be by pattern traders. In other words, if a notable double top shows up in an asset that you’ve recognized has a negative sentiment overtone, the double top can be used as a point to sell into because it will receive notoriety as a strong resistance level and that alone will cause for more selling at that level (a self-fulfilling prophecy).
Final Notes on Price Action Patterns
Never forget that the more popular and clear the price actions pattern is, the more likely other participants will be making their trading decisions based on it. With a dash of intelligent use of your understanding of sentiment, you can play these major price action patterns as self-fulfilling prophecies that function like those traders expect or instead use them as signs of where weak hands will be entering and trade against them.

